
 By Roger Halliday, Chief Statistician
It has been a few months since my last update on the sex and gender in data working group, and that is down to the work being paused while I have been focussed on jointly leading the Scottish Government’s COVID-19 Modelling and Analysis team. Through this we have been providing important evidence to support decision making during the pandemic.
In my last update back in March I shared with you details about the public engagement events that we had held, and how the views from these were being considered as I started putting together a first draft of guidance. I outlined my intentions to share this with stakeholders, and those who had shown an interest in the work, once it was drafted to seek further views.
This guidance has been put together in a way that aims to balance the different views I have heard from organisations and individuals’ that I met over the course of our first phase of engagement, and who kindly shared their views and evidence. I reflected on what I heard and brought this guidance together in consultation with members of the working group. It’s not been straightforward, and I am keen therefore, to seek feedback on this draft and consider any comments before I present a final proposal to Ministers (as you’ll know, my aim is to provide advice to Ministers on how to improve the collection, disaggregation and use of data on sex and gender by Public Bodies in Scotland).
For me, it’s really important that people have the opportunity to input to this work. Since this work has begun to pick up again I am pleased to share with you more detail about our plans to do this.
Over the coming weeks I will be publishing the draft guidance on the proposed key messages and recommended questions we have set out to support public bodies to collect, disaggregate and use data on sex and gender. I’ll be sharing the draft guidance directly with those who have previously shown an interest in the work, or have been involved during the first phase of engagement. For others who would like to comment, these documents can be accessed via the Sex and Gender in Data’s group page.
I look forward to receiving your comments before Friday 12 Feb. I will balance the views expressed to refine these proposals and to shape the expectations I set for colleagues across the public sector. The ambition has not changed. Ensuring data about sex and gender that is needed is collected appropriately and used well is an important part of achieving our ambition of a country with opportunities for all of Scotland to flourish.
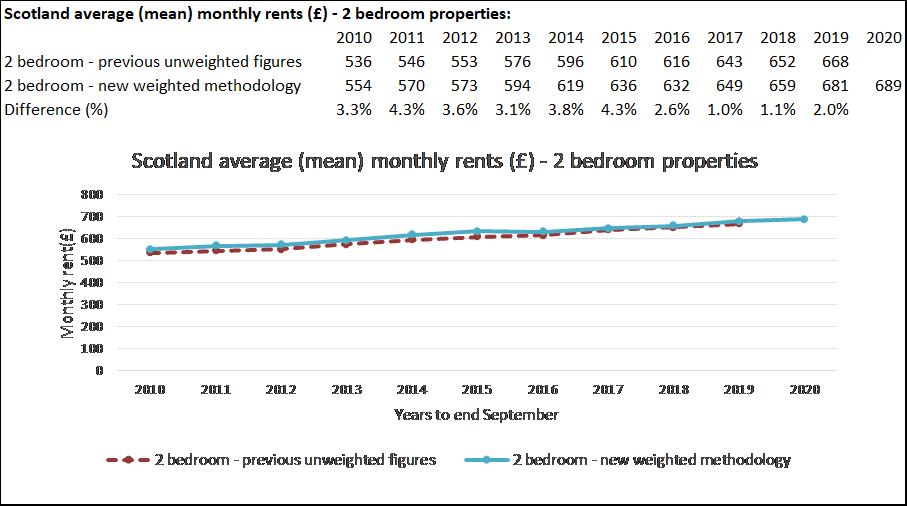
We’re making changes to the way that we calculate average rents at a Scotland level within our annual Private Sector Rent Statistics publication.
Previous approach
In previous publications, the Scotland level average rent figures have been calculated using an unweighted average. Average rent level figures in each area were combined into an overall Scotland figure simply based on the number of records in the underlying rental sample data in each area of the country.
What’s changing?
For the latest publication we have calculated Scotland level figures using a weighted average approach based on separate Scottish Household Survey data on the profile of private rental stock by area and property size over time.
This is to help improve the quality and robustness of the national average rent figures. It will help to ensure that the national average figures presented better reflect changes to the underlying composition of private rental properties over time, and to minimise any effects of changes to sample numbers achieved for particular property sizes or areas in any given years.
Other publication figures on average rents at an area level have been unaffected by this change.
Further details on the weights used
Stock based weights for rented properties have been derived from Scottish Household Survey data, using 3 year rolling data periods. Each 3 year data period has been centred on the rental year to be estimated, with a lag applied of 2 years, due to the time delay between 3 year survey results being available and the latest rental year in question.
For each main property size category (by number of bedrooms), the stock based weights are based on the proportion of private rented households of each size that are located in each of the 18 ‘Broad Rental Market Areas’, using an approximate local authority to rental market area mapping.
For 1 bedroom shared properties (i.e. rooms rented in shared accommodation) the weightings are instead based on the estimated proportions of owner occupier or private rented households in each area that contain two or more adults who are not related or who are not in a married / civil partnership or a co-habiting partnership. This is with the aim to identify the number of households in each area where there may be an individual room being rented in some form.
Further details are available in the publication in Annex D, which provides a full Revisions Note on these methodological changes.
What impact has this had on the figures?
Whilst the use of weights changes some of the individual year average figures compared to the previous unweighted figures, the overall trends over time broadly remain similar for each property size category.
For 2 bedroom properties, the most common size of property in the private rented sector, the weighted figures are slightly higher than previously published unweighted figures across each year 2010 to 2019, with an average annual difference of 2.9%, see chart below.
This slight increase in average rent levels when using the new methodology can be accounted for by some areas having a higher “weight” in the calculations when compared to the previous unweighted average, and where these areas have higher than average rent levels, for example in the Lothian area.
We welcome your views and feedback on this change, and you can email us at housingstatistics@gov.scot
by Roger Halliday, Chief Statistician
Over the last few months, we have faced an extraordinary situation in relation to COVID-19 and all the challenges that has brought and we thought it was a good time to touch base regarding our data access arrangements.
The current situation has progressed enough to allow a slight decreased in pressures on the analytical staff within the Scottish Government. The revised process can be found in this statement.
As part of Scotland’s Covid-19 testing strategy, Scotland is participating in the Office for National Statistics (ONS) COVID-19 Infection Survey. The first estimates of the percentage of people in Scotland who test positive for COVID-19 were published today, 23 October. The Scottish results are published on the gov.scot website, and on the ONS website alongside results for England, Wales and Northern Ireland.
What is the Covid infection survey?
The COVID-19 Infection Survey aims to find:
- how many people test positive for COVID-19 infection at a given point in time, either with or without symptoms
- the average number of new infections per week over the course of the study
- the number of people who test positive for antibodies, to indicate how many people may have already had COVID-19
The survey is building up to testing 15,000 individuals per fortnight. By carrying out mass testing regardless of whether participants have COVID-19 symptoms or not, the survey will help track the current extent of infection and transmission of COVID-19. As well as looking at the number of positive cases, the survey will be used to examine the characteristics of those testing positive for COVID-19, and the symptoms that they may experience.
The results from the survey will be used in many different ways in order to inform the response to the pandemic. After reaching the target of 15,000 individuals tested per fortnight, the sample size for this survey will be large enough to allow for regional analysis to provide a more local picture of how the virus is affecting Scotland.
Carrying out the survey
The survey is being conducted by the Office for National Statistics (ONS) and the University of Oxford, on behalf of the UK and Scottish Government. The survey also operates in England, Wales and Northern Ireland.
Survey teams started to visit participant households in Scotland on Monday 21st September. Invitations were sent to randomly sampled private households across Scotland. Participants provide self-administered throat and nose swabs to test whether they currently have the virus. A subset of the total number of participants (20%) are also invited to provide blood samples, which will be tested for the presence of COVID-19 antibodies. Blood samples are only taken from individuals aged 16 and above and will be taken by a trained nurse, phlebotomist or healthcare assistant.
Participants are asked to repeat this survey over either a month or 12 months. This involves:
- a visit once a week from a member of the survey team to collect a throat and nose swab. This will happen for 4 weeks in a row, after the first visit.
- a visit once a month after this, for 11 months in a row, to collect a throat and nose swab. If providing a blood sample, participants will be asked to provide a blood sample every month after the first appointment.
Each participant is also be asked a short set of questions about socio-demographic characteristics, symptoms, whether they are self-isolating or shielding, and if they have come into contact with a suspected carrier of COVID-19.
Only private households are included in the survey, meaning that people in care homes, other communal establishments and hospitals are not included.
Survey results
Due to response rates being higher than initially expected, the first results for the percentage of the population testing positive for COVID-19 were made available for Scotland on 23 October. Scottish results for the survey will be published weekly, and will be available on gov.scot as well as on the Office for National Statistics website, where they are published alongside results for England, Wales and Northern Ireland.
As the sample size is increased in subsequent weeks, more detailed analysis such as such as examining the characteristics of those testing positive for COVID-19, establishing the average number of new infections per week, and the number of people who test positive for antibodies to indicate how many people are ever likely to have had the infection will follow.
If you’ve been invited to take part in the survey you can find out more on the ONS website.
Information on the survey methodology can be found here.
We are changing the way we report the COVID-19 positivity rate as of 19 October 2020. The new approach addresses a limitation of the previous approach. This blog outlines why we are making this change and what its impact will be.
Current approach
The Scottish Government has been reporting data on the number of new positive cases since early March 2020 on the Scottish Government website. Earlier in the pandemic, we started to report a rate based on newly reported cases each day as a proportion of newly tested individuals. For example, as at 19 October:
- 993 new cases of COVID-19 reported; this is 17.1% of newly tested individuals
This measure was implemented to provide additional context to the number of new cases as testing was stepped up. The rate was relatively low each day during Summer 2020 but was higher at the beginning of the outbreak in the Spring and began to increase again into Autumn, as infection increased. This measure has a focus on new cases – so somebody testing positive twice is not included again, regardless of the time between those results.
Its key limitation, is that as more and more people are repeatedly tested, they do not appear in the denominator as a newly tested individual but do appear in the numerator if they receive a first positive test. Therefore, it is likely to over-estimate the positivity rate, and this increases over time with more repeat tests. The main advantage of the approach was that each positive result is only counted on one day so not impacted by repeat testing.
Since this measure was first reported, further related data on covid-19 infection has been published each day on the Public Health Scotland dashboard, for example, on tests and the number of cases, including cases per 100,000 population.
What’s changing?
There are a number of possible ways to calculate a ‘percent positive’ or ‘positivity’ figure. We have decided to change the focus to an alternative daily positivity metric based on number of tests.
- Positive Tests ÷ Total Tests
This metric is simple to understand, addresses the key limitation of the current metric, and is aligned with the WHO epidemiological criteria used to determine whether the epidemic is controlled in a country; by controlled WHO mean when less than 5% of suspected samples test positive for COVID-19.
The test positivity measure will be reported each day, at a Scotland level on the Scottish Government website. A comparison of the two positivity rates, by reporting date, is presented in the following chart (from 18 Aug onwards, from when data on the new metric is available by reporting date).
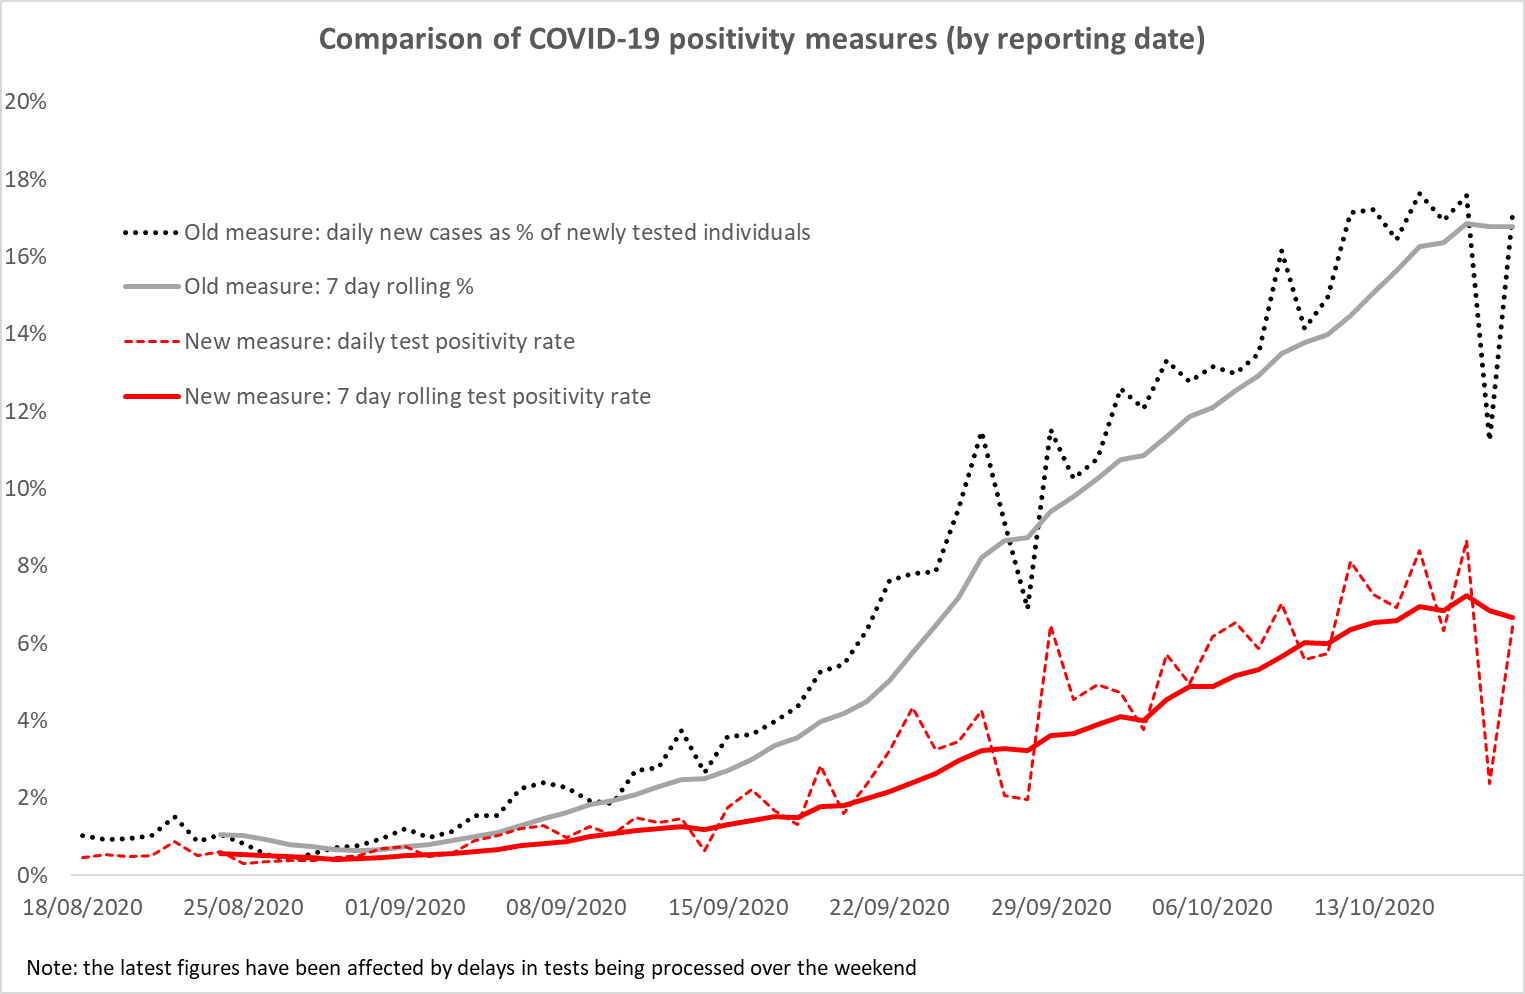
By addressing the main limitation of the previous approach, and basing the calculation on all tests, rather than only newly tested individuals the new metric has a higher denominator, and consequently provides results that are lower than previously. For example on 19 October the old positivity rate based on newly tested individuals was 17.1%, and the new test positivity rate was 6.4%.
For transparency, we will continue to make the old measure accessible by including it in our trends in daily data download but after this week we will no longer include it in our headline figures.
Further development
It will be important to have this data for local areas, and Public Health Scotland are working to make data by Health Board and Local Authority available on the Public Health Scotland dashboard. This should be available week beginning 26th October.
While this new positivity metric represents an improved approach to reporting percent positive in Scotland there remain some limitations. It refers to tests, not people, which means that if someone positive was tested more than once on the same day, then they would count as multiple positive results (and tests), although in practice this does not happen very often.
Rather than each person counting once as a ‘case’ they are counted whenever they are tested. For example, if people with COVID-19 in hospitals and care homes are regularly retested to see if they are still positive, their positive result will appear in the figures for different days. So the number of positive tests is a mix of new and existing cases.
In addition, it should be noted that as with many such positivity metrics, changes in the underlying testing strategy can affect the results. For example, where there are changes over time in the relative proportions of testing conducted as large-scale surveillance or mass testing, compared to the proportions coming forward for testing who have symptoms of COVID-19.
Approaches to producing positivity rates are also currently being explored elsewhere, and we have been speaking to analysts across the UK about this. We will continue to examine the potential for further improvements over the coming weeks including consideration of future enhancement on UK comparability and the potential for a positivity metric based on the number of individuals tested.
Additionally, the ONS Infection Survey is now underway in Scotland and will publish statistically robust COVID-19 prevalence estimates from October 23. This will monitor the percentage of people who test positive for COVID-19 infection at a given point in time, regardless of whether they report experiencing coronavirus symptoms and help track the current extent of infection and transmission of COVID-19 among the population as a whole.
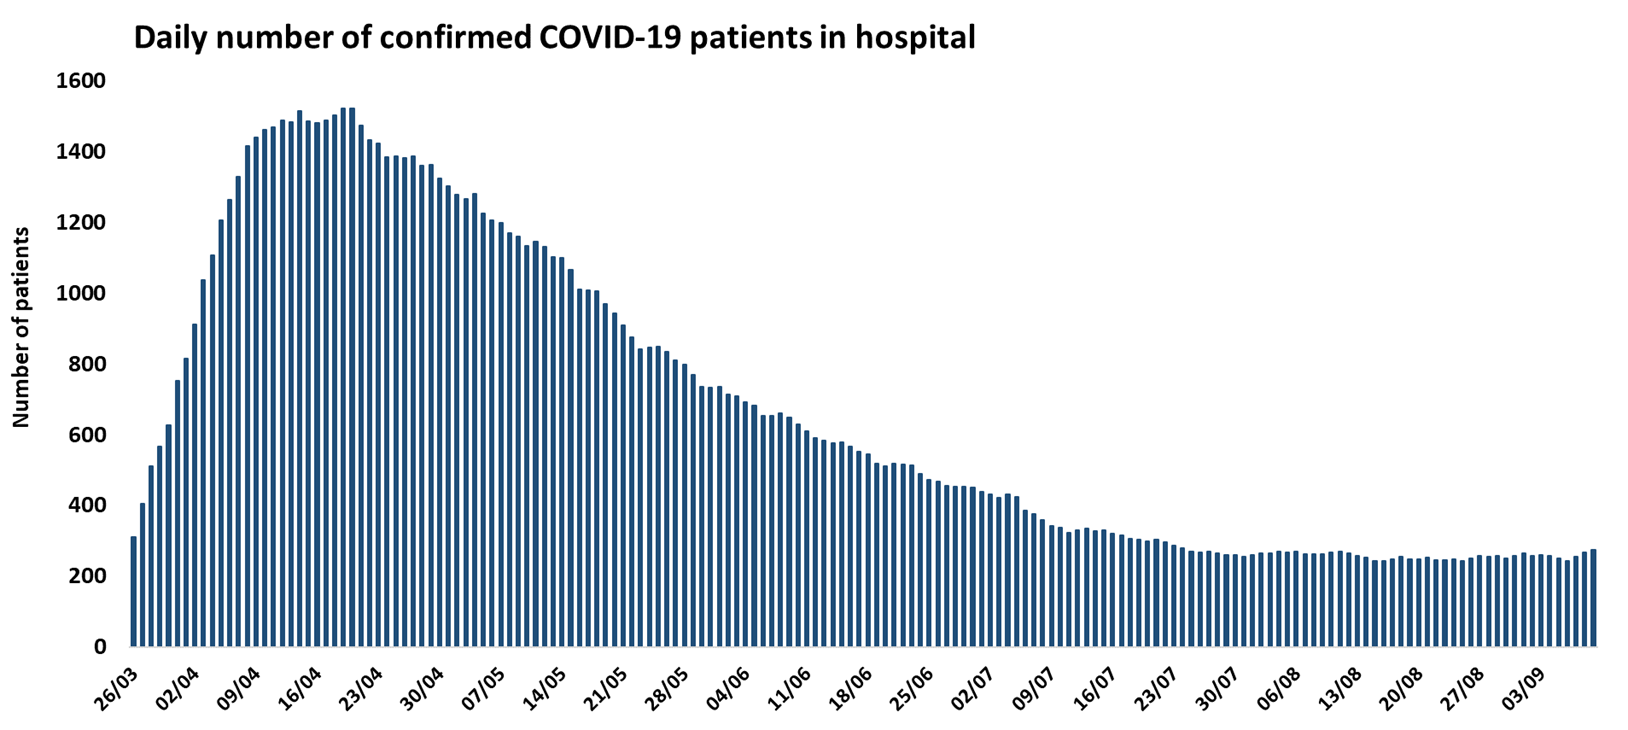
We are changing the way we count people in hospital with confirmed COVID-19 as of 15 September 2020. The new figures are lower than the previous published management information and we have a break in the time series. This blog explains why and how.
Current situation
Every day since mid-March, the Scottish Government has been collecting data on the number of confirmed COVID-19 patients in hospital from across NHS Scotland. This data collection was set up quickly to meet an immediate need to understand the impact this new illness was having on our NHS hospitals. It was important to take a pragmatic approach to this in order to avoid any additional work for hospital staff, so while an approach was defined, local areas adopted the best way to extract this from their information systems.
The measure showed a rapid increase in the number of confirmed COVID-19 patients in hospital to over 1,500 in mid-April, reflecting the situation at the time. However, the measure stabilised at around 250 into July and August. Data published daily on coronavirus.data.gov.uk shows that on 26 August, for example, there were 442 COVID-19 patients reported in hospitals in England, 48 in Wales and 17 in Northern Ireland, compared to 249 in Scotland.
In addition, data from Public Health Scotland shows that the numbers of new hospital admissions where COVID-19 was confirmed were relatively low through July and August. In early July, additional information on hospital onset
cases became available, and it was apparent that there were different types of inpatients being included in the figures provided each day by NHS boards, including those who have tested positive for COVID-19 at some point but are no longer being treated for COVID-19.
Investigation
On 26 August, we carried out a snapshot clinical audit to find out more about the relative contribution to the numbers of these different categories of patients (see below). In addition to using the available administrative information, this work involved clinicians in order to fully understand the status of current inpatients. The audit confirmed that the majority of COVID-19 inpatients reported in the daily published statistics were in hospital for an ongoing condition following a resolved COVID-19 infection, or for a condition unrelated to COVID-19. The majority of these were in the two largest Health Boards (Greater Glasgow & Clyde and Lothian), while some other Boards had previously adapted their own definitions to only include current cases, for example Fife did this in June resulting in a decrease in their figures.
Audit findings
The audit of inpatients identified 384 patients in hospital at 1am on 26 August across Scotland who had previously tested positive for COVID-19.
The majority of these patients (87%) were in hospital for a condition unrelated to COVID-19:
- 45% were hospital onset cases who were no longer being isolated or treated for COVID-19;
- 25% had recovered from COVID-19, been discharged and then readmitted for an unrelated condition;
- 9% had a previous positive COVID-19 test in the community, and were admitted for an unrelated reason
- 8% had been admitted for COVID-19, had recovered but were still in hospital for other reasons.
The audit showed that 8% of patients were either receiving treatment for COVID-19, were in rehabilitation after their treatment for COVID-19 was completed, or were in hospital for COVID-19 related complications. (5% of patients could not be classified into the above categories.)
What’s changing?
In order to make sure we are not counting people who are no longer being treated for COVID-19, we are introducing standard time periods after testing positive for hospital inpatients to remain included in the figures. Only patients who first test positive in their current hospital admission (or in the 2 weeks before admission) will be included. And they will stop being counted after 28 days in hospital (or after testing positive if that is later).
Because this is essentially a statistical rather than clinical definition, there will potentially be some patients who are still in hospital and ICU because of COVID-19 who will no longer be counted after 28 days. But overall, by making sure we are excluding those inpatients with a previous positive COVID-19 test who are now in hospital and ICU for unrelated reasons, the information will be more representative of the current situation in hospitals and more sensitive to any changes caused by new cases. We will keep this under review.
Comparing the initial data, it’s clear to see the impact of the change. The total number of confirmed COVID-19 inpatients under the previous definition was 262 on Tuesday 15th September while the new definition included 48 patients. Of these, 7 were in ICU on the old basis, and 6 under the new definition. We will no longer collect the data on the original basis.
Defining the measures in this way means that the data can be extracted from local information systems without requiring clinical input. This is a pragmatic solution that will ensure we are better placed to capture the impact of the evolution of the pandemic.
by Roger Halliday, Chief Statistician
I recently participated in the Administrative Data Research (ADR) Scotland public panel to discuss the development of Research Data Scotland (RDS) and focus specifically on the principles that underpin the new service.
The ADR Scotland public panel was created as a vital forum for understanding the views and perspectives of the public about the use of administrative data and to help to ensure research maximises public benefit in order to improve policies, services and, ultimately, lives. The panel consists of members of the public from across Scotland, from a range of different backgrounds and lived experience.
Our starting point for the discussion was the set of principles that underpin RDS’s overall mission to improve the economic, social and environmental wellbeing in Scotland by enabling access to, and linkage of, data about people, places and businesses for research in the public good. These principles are;
- RDS will only enable access to data for research that is for the public good
- RDS will ensure that researchers and RDS staff can only access data once an individual’s personal identity has been removed
- RDS will ensure that all data about people, businesses or places is always kept in a controlled and secured environment
- RDS will only create a dataset if it is requested for a research programme or study that is in the public good
- All income that RDS generates will be re-invested into services to help researchers continue to access data
- Firms that access public data for the public good through RDS will share any commercial benefits back into public services
- RDS will be transparent about what data it provides access to and how it is being used for public benefit
We had an engaging discussion about how ‘public good’ is defined. I explained that RDS is building upon the existing process where public benefit and privacy panels scrutinise data requests to assess their public benefit. Users of the RDS service will still need to make the case about how their proposed research project will improve wellbeing and reduce inequalities across Scotland.
I also provided a short update on our ongoing engagement with data controllers and progress against securing a range of data holdings. As part of the ADR Scotland partnership, operating within ADR UK and funded by the Economic and Social Research Council (ESRC), we have been working with data controllers across Scotland to secure a range of data holdings that are broadly aligned with Scotland’s National Outcomes.
We discussed how datasets held by RDS would be kept relevant for the future in light of, for example, socioeconomic movements. RDS will never hold onto data unless there is a clear purpose for doing so. However, there can also be exceptions in certain situations. As a result of this conversation, I have now spoken to colleagues at the SAIL databank about their data retention policies. I’m going to reflect upon their advice to develop a data retention arrangement for RDS which includes the safeguards to ensure we go about holding onto data in a safe and transparent way. My intention is to join a future meeting of the public panel to provide an update on this, as well as the other areas discussed, and seek any further feedback.
One area that generated more detailed discussion was around the topic of working with the private sector and how RDS intends to work with private companies who may want to request access to data.
I highlighted that RDS will carefully review all data access requests to confirm that the requestor holds the appropriate level of accreditation, ensure that the research is in the public good and in line with the data controller’s recognised use of their data. The first thing that any private company would have to do would be to partner with someone in the academic or public sector. Any data leaving the data safe haven would always be at an aggregate level and all research outputs will be checked to ensure they do not allow people or organisations to be identified.
To further support transparency, RDS will also develop an open register that captures uses of the data, details of who has accessed it, when and what happened to it. A condition of a researcher getting access to data would also be an agreement to publish the results. It is clear this is an area that needs careful consideration with appropriate measures put in place and this is something we will focus as we continue to develop the service.
I’m very grateful to the public panel for their time and comments and would welcome further discussion as we continue to develop RDS, so please get in touch via the RDS website if you’d like to be involved.
by Roger Halliday, Chief Statistician
For Scotland to continue to develop an approach to minimising the health, social and economic risks from COVID-19, we need robust and responsive evidence to make informed, real-time decisions in relation to the pandemic and to learn as we go.
For this reason, we have set-up the Scottish COVID-19 Data and Intelligence Network to build on the existing community of data expertise and make best use of the data already available across Scotland. The network is a partnership of expertise from across Local Authorities, Health Boards, Directors of Public Health, Health and Social Care Partnerships, Public Health Scotland, Scottish Government, academia and other public bodies.
The network aims to identify, prioritise, and develop data and intelligence products that address some of the key challenges relating to COVID-19 and ultimately help to improve lives.
The network has already delivered:
- A COVID-19 data research service that provides secure access to data to help provide answers to key analytical and research questions about the nature of spread, risks and effects of COVID-19,
- A management information system for ‘Test and Protect’, and faster sharing of data on the outcomes from the testing system,
- The Scottish Government COVID-19 Four Harms Dashboard which brings together data and evidence on the broader impacts of COVID-19,
- Disease surveillance dashboards to support national and local decision making and to help the public understand and manage risk.
The next steps have been to focus on specific data challenges that include:
- What data gives an early warning of COVID-19 clusters and helps us to monitor outbreaks?
- What has been the impact of COVID-19 on health and social care inequalities?
- What are the geospatial datasets that can underpin our COVID-19 response and how can we safely share this data with those who need it?
- What are the biggest risk factors for getting and being adversely affected by COVID-19? And how can we use this intelligence to identify and support the most vulnerable people in Scotland?
- What factors contribute to care home vulnerability?
Throughout, the network will continue to follow the safe and secure arrangements established in Scotland for the use of data to ensure privacy and ethical data use is maintained. This includes ensuring the network’s activity is underpinned by a valid legal basis, using the Public Benefit and Privacy Panels to scrutinise the use of data and working with data infrastructure delivery partners who will have the highest level of UK accreditation standards. We are working to develop approaches enhancing these processes so they provide the same level of rigour, and enable data sharing to happen faster and more consistently.
As Scotland continues to drive down the number of COVID-19 cases and new challenges arise over the longer term, we will continue to develop a sustainable network to meet the public sector’s information needs. I’d welcome any feedback on the products we have developed or new issues that you would like us to address. Similarly, if you are a data owner or have data expertise that you think could be useful, then please get in touch.
Blog Updated on 28/07/2020
We have been publishing data every day since early April on the Scottish Government website. Given where Scotland is now in the pandemic, we think it’s a good time to refocus this publication.
Some of the information developments in Scotland include:
Public Health Scotland COVID-19 data – the weekly report published every Wednesday includes the latest data and trends on cases, hospital and ICU admissions, patient characteristics and Test & Protect. There is also a cases dashboard which is being developed further to include testing information and local area time series, as well as a wider health harms dashboard.
Scottish Government COVID-19 Four Harms Dashboard – updated every Monday at 14:00, this brings together data and evidence on the broader impacts of COVID-19. These are referred to as the four harms of COVID-19:
- direct health impact
- wider health impacts
- societal impacts and
- economic impacts
Work is also underway on a new public facing resource that will include interactive maps of COVID-19 cases at local authority level. We are working with Public Health Scotland to release this in July with plans to add further data in future.
The table below shows our planned changes for Wednesday 22/07/2020, but we will continue to review the site as things develop.
|
Changes planned for Wednesday 22nd July |
|
|
Overall layout |
We will rearrange the layout of the page from a topic basis to a daily, weekly and since the start basis so people can see the latest figures first. We will include key weekly figures on hospital and ICU admissions from PHS and deaths from NRS. |
|
Scottish numbers
|
These will be updated daily – and will likely include key information on testing, cases, deaths, care homes and hospitals.
We will continue to work with partners to improve the quality of data and will publish the total number of confirmed cases in ICU for Scotland but will no longer include suspected cases, as these fluctuate due to patient screening. We will add in the total number of new tests reported (through NHS Scotland and UK labs). We will include suspected COVID-19 cases in adult care homes pending a review of this data (see below). |
|
Data by health board |
These will be updated daily and we will keep the ongoing presentation and inclusion of this table on the webpage under review as other data and dashboards are developed. |
|
Testing |
Due to the stage we are at in the pandemic, with testing for all those aged 5 and over who are symptomatic, we will no longer collect data on testing of key workers and their symptomatic household members, which commenced to allow key workers to return to work promptly. We now report on specific key workers such as care home staff.
We will continue to report the numbers of tests daily, and to date and will add a weekly figure. |
|
Care homes |
We will keep publishing the daily and cumulative number of suspected COVID-19 cases in adult care homes pending a review of the data given current low levels and caveats around the data as well as the new information that is emerging through Test & Protect.
We will update the number of adult care homes with active cases weekly rather than daily. Blog Updated on 28/07/2020 Extensive testing is routinely being carried out in care homes, enabling the identification of positive confirmed cases quickly via the Public Health Scotland (PHS) eCOSS system. The usefulness of suspected cases at this stage in the pandemic is therefore reduced. To ensure we continue to adequately monitor the situation in care homes and to provide public confidence, we will discontinue the publication of suspected cases from 29 July and replace with the number of confirmed cases among care homes residents on a weekly basis using eCOSS data. The first weekly data would be published from 5 August. |
|
Community health & care |
We will no longer report NHS24 calls, Coronavirus Helpline calls and ambulance attendances and conveyances. We will instead refer to the PHS weekly report.
We will continue to update information on numbers of people advised to shield and accessing support on a weekly basis, and will shortly also begin reporting on deaths in the shielding group (Thursdays). We will update the delayed discharge figure once a week (Thursdays) rather than every weekday. |
|
Health & Social Care Staff |
We will change to weekly rather than daily updates for NHS staff absence (Wednesdays). |
|
Excel downloads |
We will leave all data previously published as a record for information. We will stop publishing new data on suspected cases in hospital and ICU as well as those mentioned above. We will add explanatory notes to the data files.
Where we have changed from daily to weekly, where possible we will add a weekly series back in time and convert the chart to a weekly chart. |
|
Care homes page |
We will no longer publish additional breakdowns on suspected COVID-19 cases in adult care homes.
We will continue to publish weekly adult care home testing data and COVID-19 deaths reported to the Care Inspectorate. |
Current analysis and data around COVID-19
Scottish Government (SG), Public Health Scotland (PHS) and National Records of Scotland (NRS) have been working together to produce a range of information to provide insight into the COVID-19 pandemic and the effect it is having in Scotland.
Scottish Government publish daily coronavirus data for Scotland (updated each day at 2pm) that shows number of new confirmed COVID-19 cases, new reported deaths of people who have tested positive, number of tests carried out (and whether results were positive or negative), and numbers of people in hospital. It also show the number of NHS24 calls, Scottish Ambulance Service Attendances, the number of people delayed in hospital, and numbers of suspected COVID-19 cases in Care Homes.
National Records of Scotland are publishing weekly National Statistics on deaths involving coronavirus, and Public Health Scotland are releasing weekly data on the cumulative number of positive COVID-19 cases by age, sex and deprivation, admissions to ICU, daily number of COVID-19 related calls made to NHS24 and daily number of consultations with COVID-19 Community Hubs and Assessment Centres. PHS also produces daily and weekly open data, a daily cases and deaths (including excess deaths) dashboard, a weekly wider impacts dashboard, and has plans to publish different topic area COVID-19 reports.
Public Health Scotland’s COVID-19 publications are accessible here: https://beta.isdscotland.org/covid-19-and-the-production-of-statistics/ and all their forthcoming publications are accessible here: https://beta.isdscotland.org/forthcoming-publications/.
Upcoming releases of analysis and data around COVID-19
During this public health pandemic, in line with guidance from the Office for Statistics Regulation, we are planning to publish a range of additional analysis on topics such as numbers of people identified as at high clinical risk of COVID-19 and advised to shield, numbers of tests carried out, causes of death, and other analysis of demographic characteristics. We know that there is a lot of demand for this data, and doing so will make sure that information relevant to the COVID-19 crisis is openly available to inform the ongoing public debate.
Some of the data being reported is management information (data that is gathered routinely by public bodies to inform their day to day operations). Management information produced by the Scottish Government is subject to voluntary application of the Code of Practice for Statistics, and our aim is to make sure it is published in a way that maintains trustworthiness, quality and value to users. For example, difficult choices may need to be made on whether data are of sufficient quality to support the use being made, and the professional analysts producing the analysis, will balance these risks to quality with making sure that they are published as quickly as possible.
When management information is used publicly to inform Parliament, the media and the public, it should be published in an accessible form, with appropriate explanations of context and sources. It is important therefore that this information is released in a transparent way to ensure that it is equally available to all. As part of that transparency, we preannounce our plans for what management information is going to be published, and when, noting that these analyses are often complex and involve multiple data sources, and plans may by necessity be updated at short notice.
Our current plans for release of new information are:
- Data on adult care homes and COVID-19 deaths reported to the Care Inspectorate: https://www.gov.scot/publications/coronavirus-covid-19-daily-data-for-scotland/ (released on Wednesday 3 June, weekly thereafter)
- Data on number of people identified as at high clinical risk of COVID-19 and advised to shield: https://www.gov.scot/publications/coronavirus-covid-19-daily-data-for-scotland/ (confirmed for Thursday 4 June)
- Blog Updated on 25/06/2020. Public Health Scotland’s weekly report will include updated COVID-19 data including Test and Protect data. PHS will be releasing new data on their COVID-19 wider impacts dashboard (and this will be signposted to in their weekly report): Data on stillbirths and infant mortality (confirmed for Wednesday 1 July). Other topic areas will follow in subsequent weeks: https://beta.isdscotland.org/covid-19-and-the-production-of-statistics/
- Blog Updated on 14/07/2020. Enhanced Surveillance of COVID-19 in Scotland Population-based seroprevalence surveillance (confirmed for Wednesday 15 July). The serology work stream aims to estimate the proportion of people who have antibodies to coronavirus (“seroprevalence”) in the general population of Scotland and to see if this changes over time. This will be released at 12:00. Please note: this release has been rescheduled from 9 July to allow for further data quality assurance.
- Additional analysis will be published by National Records of Scotland for May covering deprivation, age-standardised rates, leading causes of death, pre-existing conditions, and urban rural breakdowns. There are also plans to include age-standardised death rates for Health Boards and local authorities, deaths by intermediate zone and (possibly) a breakdown by occupation: https://www.nrscotland.gov.uk/statistics-and-data/statistics/statistics-by-theme/vital-events/general-publications/weekly-and-monthly-data-on-births-and-deaths-registered-in-scotland (on 17 June)
- NRS are also currently testing whether data from the 2011 Census can be used to produce an analysis of death registration data by ethnicity.
Open data around COVID-19
Scottish Government, National Records of Scotland, and Public Health Scotland are all publishing open datasets on the COVID-19 pandemic for people to use and reuse. This helpful blog post gives more details of what is available and where to access these sources of open data on covid-19.
The Office for National Statistics have also published their plans for further analysis of COVID-19 data.