
Statistics
Statistics.gov.scot — our open data resource
July 4, 2019 by liamcavin1 No Comments | Category Uncategorized
by Sarah Roberts, Swirrl
Whether you want to understand a community or make decisions backed up by evidence, data helps. Open data that can be shared, combined, downloaded or used to build tools off is even better! In this post, I interview Liam Cavin, from the Scottish Government, about freely available data you can use right now at statistics.gov.scot.
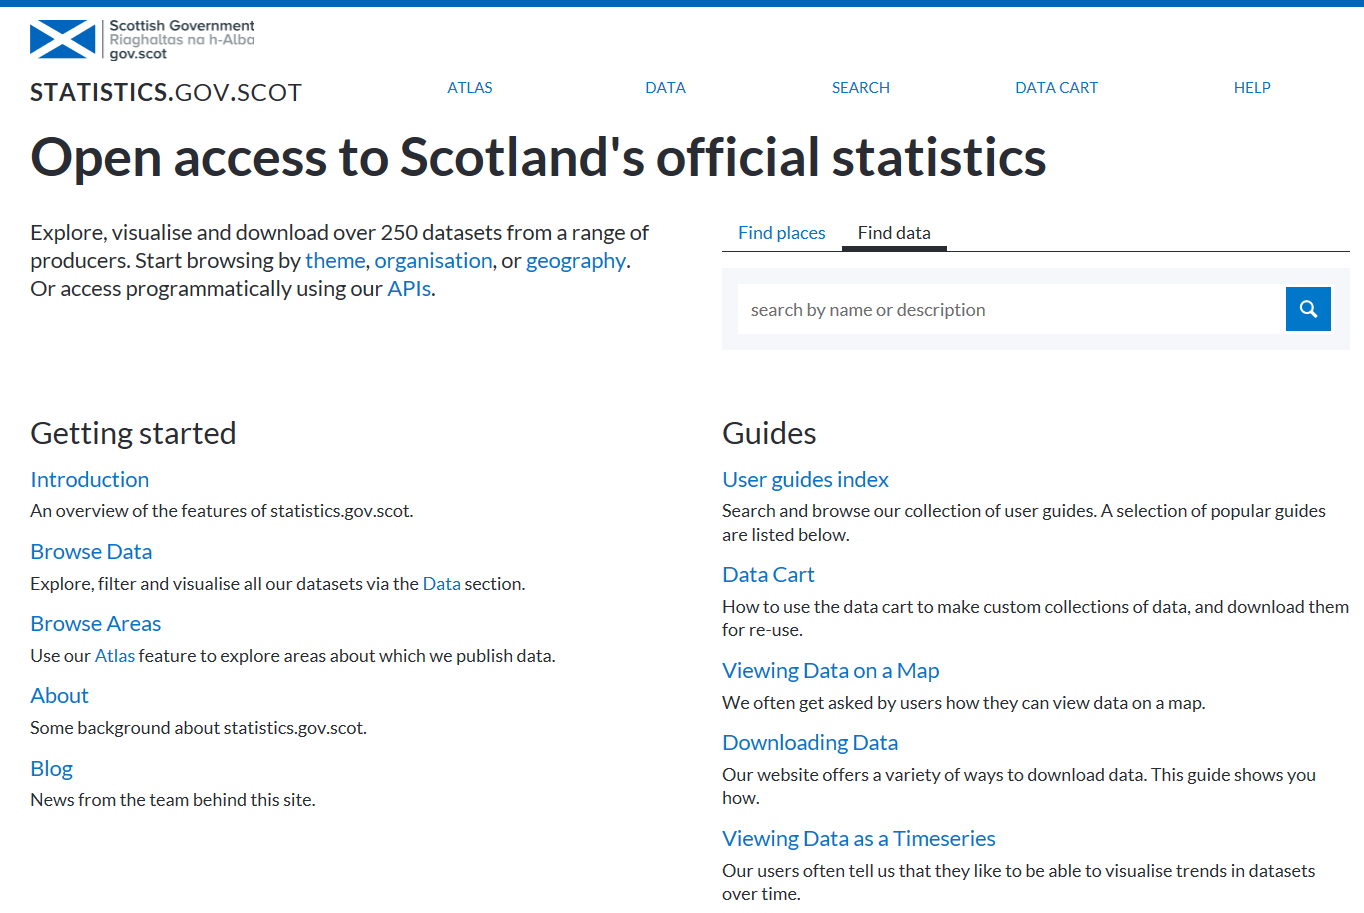
statistics.gov.scot: over 250 freely available collections of open data
Hi Liam. Please can you tell us what statistics.gov.scot is and what it contains?
Yes of course. It’s a data portal — a store of information that describes Scotland and the areas and communities within Scotland. It contains over 250 collections of information (our datasets) which you can link to, share, download or use to make something with. The data on the platform is mostly official statistics: that is, statistical information published by the Scottish Government, government agencies such as the NHS, and in some cases from UK central government departments. It isn’t personal information; it preserves individual anonymity because it’s aggregated.
The idea behind it is that access to good quality information lets us understand the communities we live in and lets us make decisions backed up by evidence. It contributes to our overarching aim, which is to help people make decisions informed by high quality data: saving time, money and lives.

There are lots of ways to get to the data . The Atlas section lets you find data by place.
Who‘s using the data, and what are they using it for?
Our data portal has a wide range of users. One of the key things you can do with it is to look up and find information about a place and that accounts for a lot of use. The Atlas section on the site allows you to look at an individual place, find out where it is and how it relates to other areas in Scotland. So, if you’re looking at a local community you can find out which local authority it’s in, which health board covers it and how many people live there. Atlas webpages about areas in Scotland come with area profile tables, which are a handy collection of key facts about places.
But the site can be used for more than that because it allows people to really get into detailed data. A few examples are:
- Local area researchers and councils who use data held on communities to provide evidence for their local area improvement plans
- Academics using local area data to conduct analysis for transport infrastructure projects
- Students who contact us for National Records of Scotland demographic information for their projects
- Private sector companies. For example, we’ve had pharmacists use health data on the site to identify the uptake of various health programmes for areas and whether that uptake relates to the demographic profile of people who live in the areas they serve. And marketing campaigns which use data related to types of property and people living in a place.
What about internal, government use?
What we really want to do is to give a wide range of access to the data to everyone, not just those working internally. We acknowledge some people are experts in data and some aren’t, so one of the things our analysts are doing is using the information on the platform to build apps to help communicate the data further.
We can build the apps because the platform itself makes the data we publish machine readable (as well as human readable). The API on the site means we can get at the data and reuse it to create apps, visualisations or dashboards with.
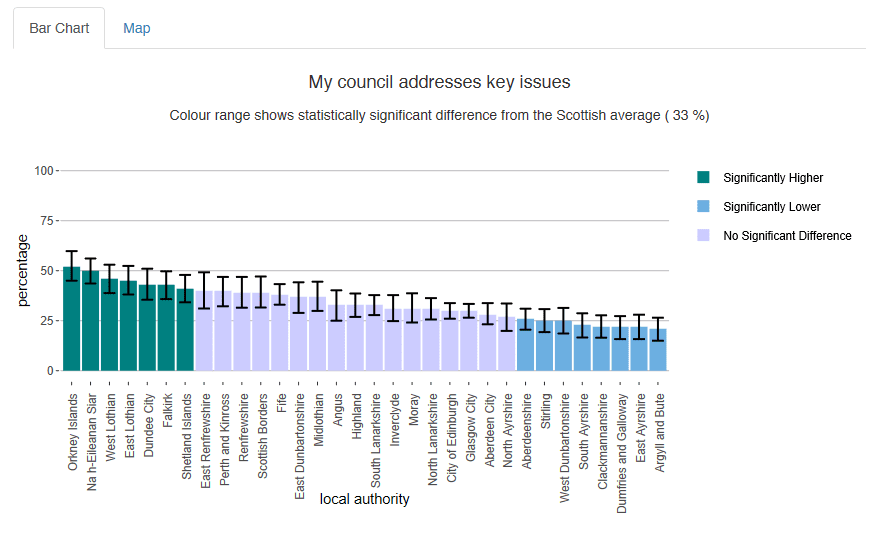
An example of an interactive visualisation for the Scottish Household Survey, made with the API available on statistics.gov.scot
What are the benefits in publishing your data this way?
Traditionally government statisticians have published excel files, which are great for human eyes but as soon as anyone wants to do analysis they have to spend time unpicking it to get it into a format that’s good to use. What’s useful on our platform is that all data on the website is in consistent format and there are common identifiers so data can be used together and we know things are referred to by the same name. When definitions are harmonised, it means the collections of data are ready for analysis. This sounds simple but it hasn’t been done before and it allows people to get the most benefit.
We’re giving people access to a wide range of information in one place – so it’s easily findable. Every dataset comes with contextual information – so that they are understandable. And it’s all designed to be interoperable – so any dataset is easy to combine with other sources of information.
What are the challenges?
The data portal launched in 2016 to provide free, open access to official statistical data in a consistent format. We’ve increased the number of datasets to over 250 but it’s clear there’s more to be done including
- Gaps in data. Currently we don’t have National Performance Framework data on the site, for example.
- Getting more small area data and putting it on the website. People who use the website repeatedly tell us they’re interested in small area data. This is data that uses sub-local authority level geographical units, such as data zones or intermediate zone. Small area data enables people to understand topics at community level. It’s challenging for statisticians because you have to take care not to release personal info but it’s one of the things we’re keen to do.
- We’re aware that the ability to use and understand datasets isn’t evenly spread around so we want to use the data to create local area profiles and interactive apps. We’ve started training for people working at the Scottish Government, National Records Scotland and NHS Scotland which will enable them to make these interactive products, so people who aren’t data experts can access and play with the information. In that spirit we want to make code available for those apps so it’s visible for others to learn from too.
How can someone get help with using the site?
The website is already well populated with help information. Every page on the website has a button at the top of the screen which will take you to a series of guides about the website. These guides range from the basics (like how to use and interpret it) all the way up to expert level of how to use and access data on a dataset programmatically. On top of that every dataset comes with an about tab which provides contextual information that anyone needs to understand what they’re looking at.
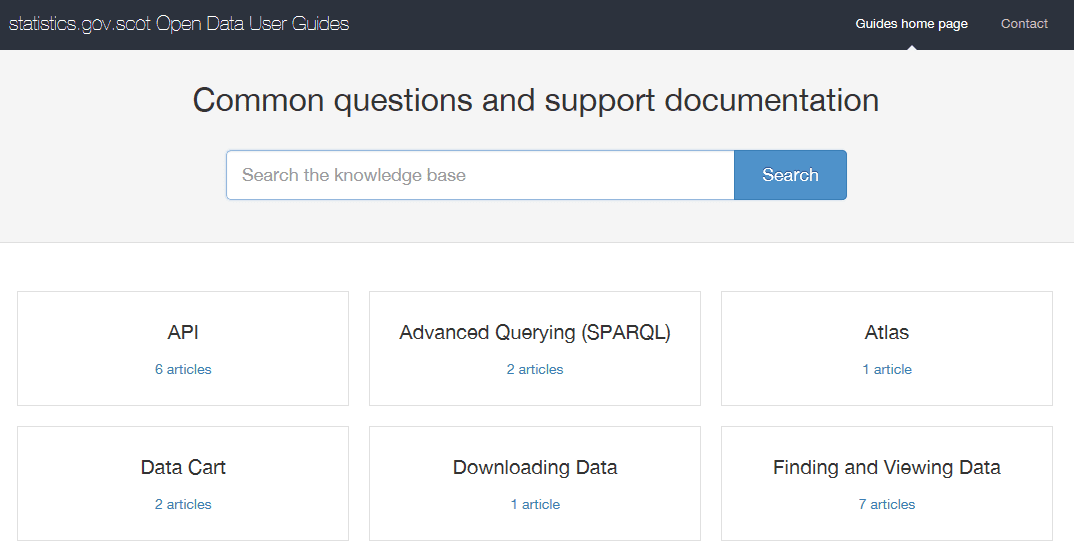
There are a wide range of user guides about the site
With all of these different sources of help, we’re hoping users can click around and find what they need. However we’re happy to help either by email or over the phone. We have a contact email at the foot of each page and we try and respond promptly to anyone who sends us an email enquiry. There’s also contact details for the teams who produce the data in the first place. Don’t be shy about emailing — we have an open offer of help and support for anyone wanting to use the data. We also provide free training: so if you work for an organisation or have a group of people who are interested, contact me at statistics.enquiries@gov.scot.
Tags: linked data, open data, statistics
Leave a comment
You must be logged in to post a comment.