
Statistics
New headline measure of COVID-19 test positivity rate
October 19, 2020 by Office of the Chief Statistician 2 Comments | Category Health and social care
We are changing the way we report the COVID-19 positivity rate as of 19 October 2020. The new approach addresses a limitation of the previous approach. This blog outlines why we are making this change and what its impact will be.
Current approach
The Scottish Government has been reporting data on the number of new positive cases since early March 2020 on the Scottish Government website. Earlier in the pandemic, we started to report a rate based on newly reported cases each day as a proportion of newly tested individuals. For example, as at 19 October:
- 993 new cases of COVID-19 reported; this is 17.1% of newly tested individuals
This measure was implemented to provide additional context to the number of new cases as testing was stepped up. The rate was relatively low each day during Summer 2020 but was higher at the beginning of the outbreak in the Spring and began to increase again into Autumn, as infection increased. This measure has a focus on new cases – so somebody testing positive twice is not included again, regardless of the time between those results.
Its key limitation, is that as more and more people are repeatedly tested, they do not appear in the denominator as a newly tested individual but do appear in the numerator if they receive a first positive test. Therefore, it is likely to over-estimate the positivity rate, and this increases over time with more repeat tests. The main advantage of the approach was that each positive result is only counted on one day so not impacted by repeat testing.
Since this measure was first reported, further related data on covid-19 infection has been published each day on the Public Health Scotland dashboard, for example, on tests and the number of cases, including cases per 100,000 population.
What’s changing?
There are a number of possible ways to calculate a ‘percent positive’ or ‘positivity’ figure. We have decided to change the focus to an alternative daily positivity metric based on number of tests.
- Positive Tests ÷ Total Tests
This metric is simple to understand, addresses the key limitation of the current metric, and is aligned with the WHO epidemiological criteria used to determine whether the epidemic is controlled in a country; by controlled WHO mean when less than 5% of suspected samples test positive for COVID-19.
The test positivity measure will be reported each day, at a Scotland level on the Scottish Government website. A comparison of the two positivity rates, by reporting date, is presented in the following chart (from 18 Aug onwards, from when data on the new metric is available by reporting date).
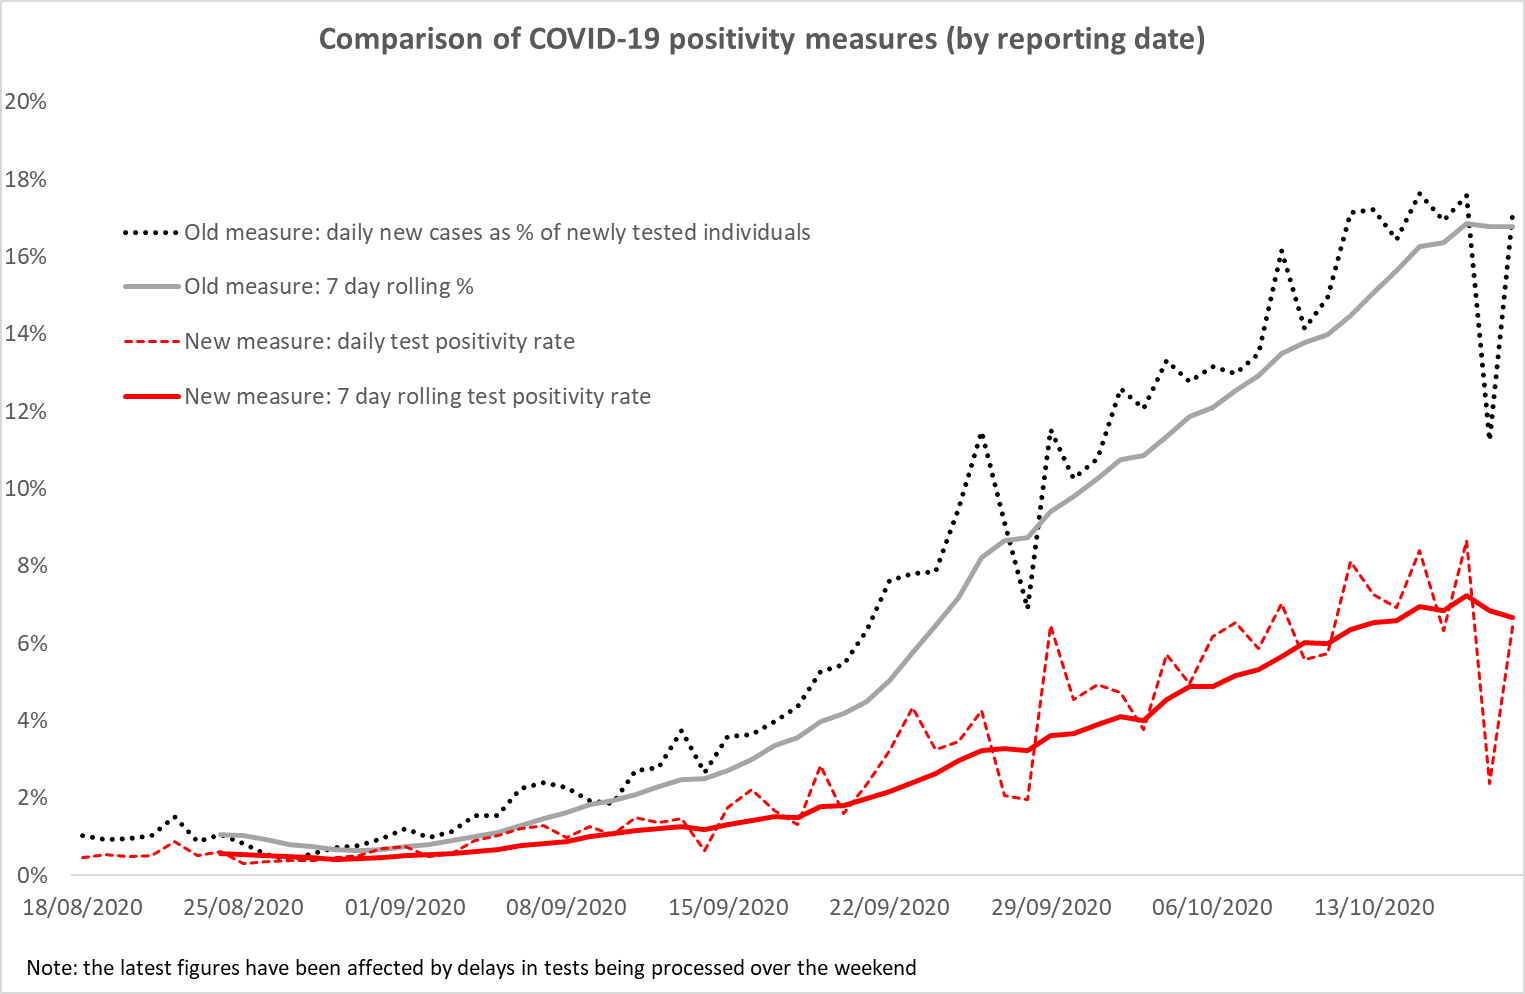
By addressing the main limitation of the previous approach, and basing the calculation on all tests, rather than only newly tested individuals the new metric has a higher denominator, and consequently provides results that are lower than previously. For example on 19 October the old positivity rate based on newly tested individuals was 17.1%, and the new test positivity rate was 6.4%.
For transparency, we will continue to make the old measure accessible by including it in our trends in daily data download but after this week we will no longer include it in our headline figures.
Further development
It will be important to have this data for local areas, and Public Health Scotland are working to make data by Health Board and Local Authority available on the Public Health Scotland dashboard. This should be available week beginning 26th October.
While this new positivity metric represents an improved approach to reporting percent positive in Scotland there remain some limitations. It refers to tests, not people, which means that if someone positive was tested more than once on the same day, then they would count as multiple positive results (and tests), although in practice this does not happen very often.
Rather than each person counting once as a ‘case’ they are counted whenever they are tested. For example, if people with COVID-19 in hospitals and care homes are regularly retested to see if they are still positive, their positive result will appear in the figures for different days. So the number of positive tests is a mix of new and existing cases.
In addition, it should be noted that as with many such positivity metrics, changes in the underlying testing strategy can affect the results. For example, where there are changes over time in the relative proportions of testing conducted as large-scale surveillance or mass testing, compared to the proportions coming forward for testing who have symptoms of COVID-19.
Approaches to producing positivity rates are also currently being explored elsewhere, and we have been speaking to analysts across the UK about this. We will continue to examine the potential for further improvements over the coming weeks including consideration of future enhancement on UK comparability and the potential for a positivity metric based on the number of individuals tested.
Additionally, the ONS Infection Survey is now underway in Scotland and will publish statistically robust COVID-19 prevalence estimates from October 23. This will monitor the percentage of people who test positive for COVID-19 infection at a given point in time, regardless of whether they report experiencing coronavirus symptoms and help track the current extent of infection and transmission of COVID-19 among the population as a whole.
Tags: COVID-19, data, health, Scotland, statistics
Comments
Leave a comment
You must be logged in to post a comment.
993 positive tests reported today/16920 total tests = 5.87%
Where does the reported figure of 6.4% come from?
On 19 October 2020 there were 1,089 positive tests and this is used to calculate the test positivity figure of 6.4%. There were 993 new cases reported that day. The total number of positive tests includes people who have previously been tested, so is a mix of new and existing cases. The number of new cases reported only counts the first positive test so is lower.