
Statistics
Scottish Quarterly GDP – An expanded visual summary
September 1, 2017 by economy No Comments | Category Economy
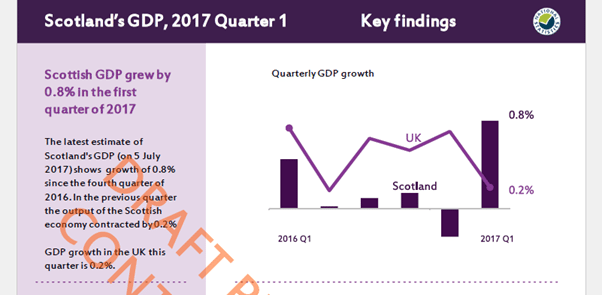
Over the past year, Scottish Government statisticians have been looking at ways of making GDP data easier to understand. In July 2017 (the 2017 Q1 publication) we published a visual summary of the GDP statistics which was extremely well received by a wide range of users. In October 2017 (for the 2017 Q2 GDP publication) we will be publishing an expanded version of the visual summary alongside the existing GDP publication, with a view to replacing the existing publication with this new format. All existing information published in the associated excel tables will continue as normal.
A draft of what the 2017 Q1 publication would have looked like using this new template plus the current publication is available here.
Most of the information in the previous iteration of the GDP publication will be in the new visual summary. The main differences are:
- An improved section to explain the industry-level drivers of change
- Charts showing the industry-level quarterly change will be published in the Excel downloadable tables but not the main summary
- Revisions over time tables moved to the Excel downloadable tables
If you have any comments about this revision or if you would like to discuss the impact of these changes please contact gdp_stats@gov.scot.